Important setting
For the correct display of the “drawing window” of indicator, terminal must have “Precise time scale” option enabled. To do this, open the platforms settings:
Tools -> Options -> Charts.
Precise time scale – Enabled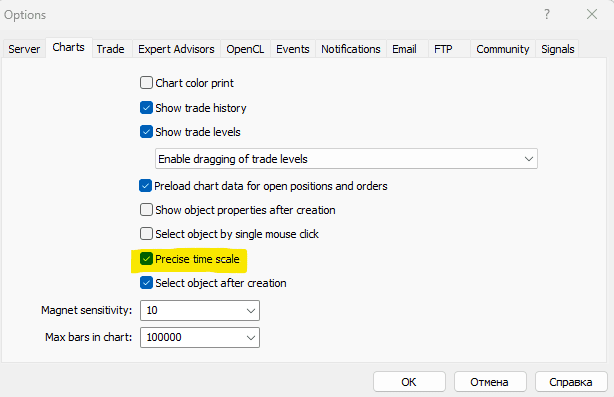
Adding an indicator
When you add the Volumos Maxima indicator to your MetaTrader 5 platform, you will see a window with its properties. Here, you can choose a color mode – light or dark – to customize the indicator’s appearance to your preference. Additionally, you can change other colors used by the indicator, such as the heatmap colors or the line colors used for the dynamic Fibonacci grid. This allows you to personalize the look of the indicator to suit your trading style and preferences.
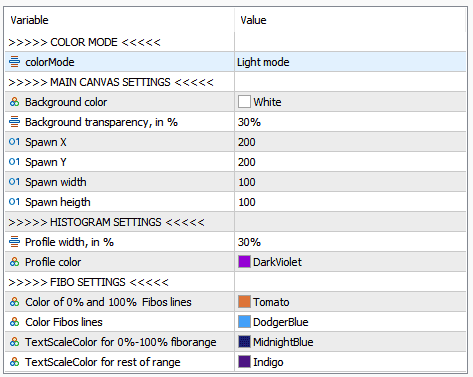
Indicators properties
Once added, you will see a panel containing several checkboxes and buttons.
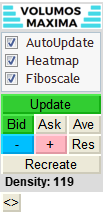
Panel
The first checkbox is the AutoUpdate feature. When this is checked, the indicator’s rectangle range will be redrawn after every move and change in chart properties. When AutoUpdate is not active, the indicator will not react to certain moves.
The second checkbox allows you to show or hide the Heatmap feature of the indicator. And the third checkbox is used to draw the dynamic Fibonacci retracement lines with arrows.
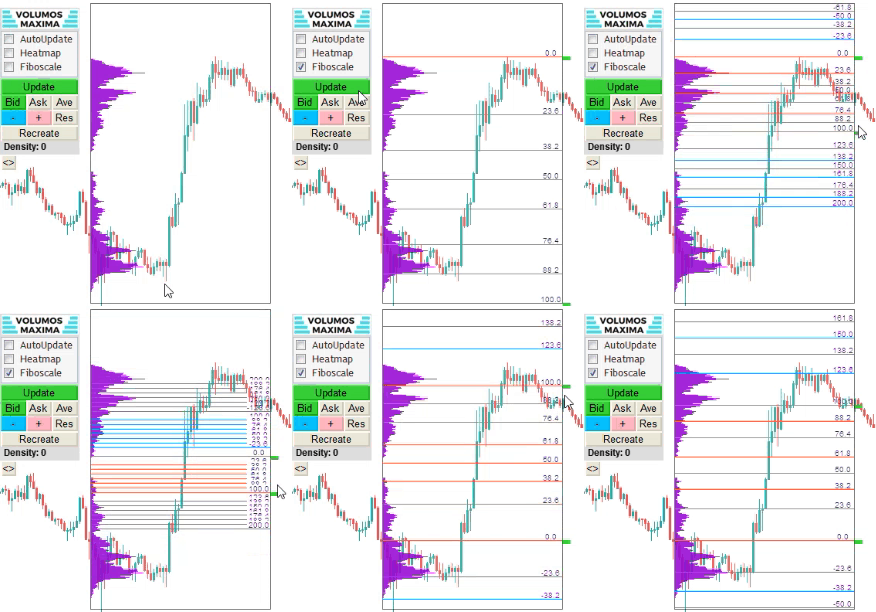
Fibonacci grid
The panel also includes an “Update” button, which can be used to manually redraw the rectangle. If AutoUpdate is not active, you can use this button to update the indicator’s display.
The panel also features three buttons for selecting the price to use in calculating the histogram. These buttons are “Bid“, “Ask“, and “Ave” (average). Additionally, there are three buttons labeled “+“, “–“, and “Res” (reset) which are used to increase or decrease the heatmap gradient, or reset the gradient to its default settings.
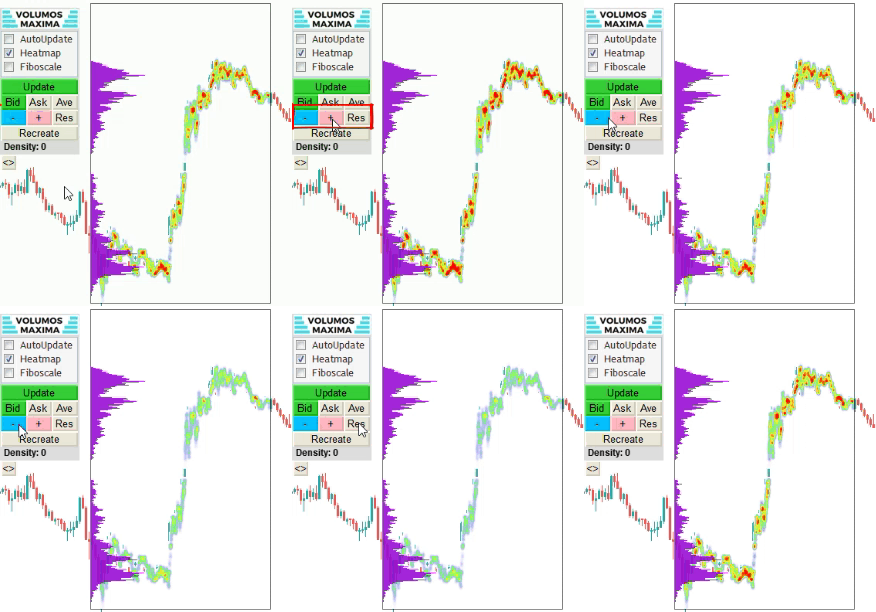
Increase /В decrease the heatmap gradient
The “Recreate” button is useful when the rectangle is not on the visual charts area. Clicking this button will recreate the rectangle so it can be viewed.
When you click on the heatmap, you can see the volume density displayed in a label. This feature is useful for identifying key levels of support and resistance based on the density of volume at certain price levels.
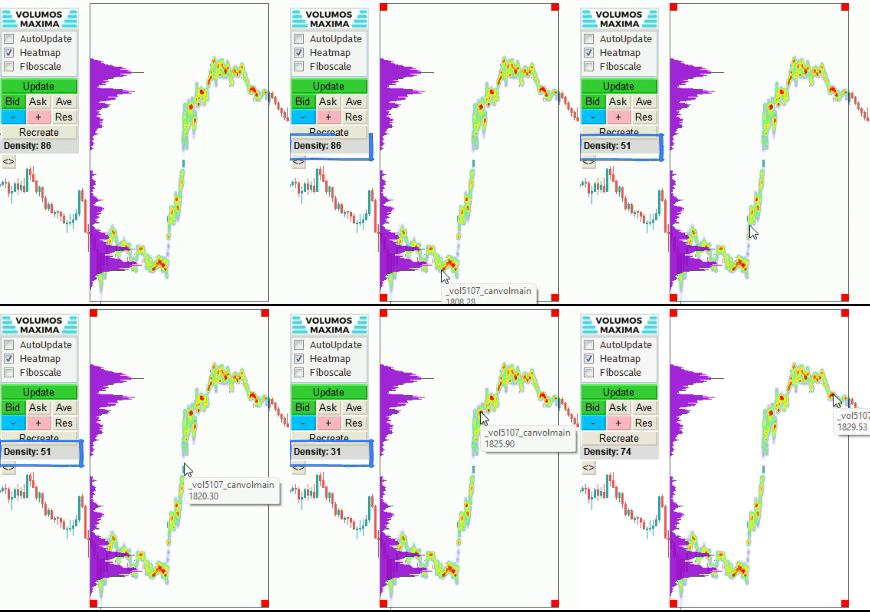
Volume clicked density
Lastly, there is a small button that allows you to hide or show the panel, giving you the ability to customize your workspace according to your needs.
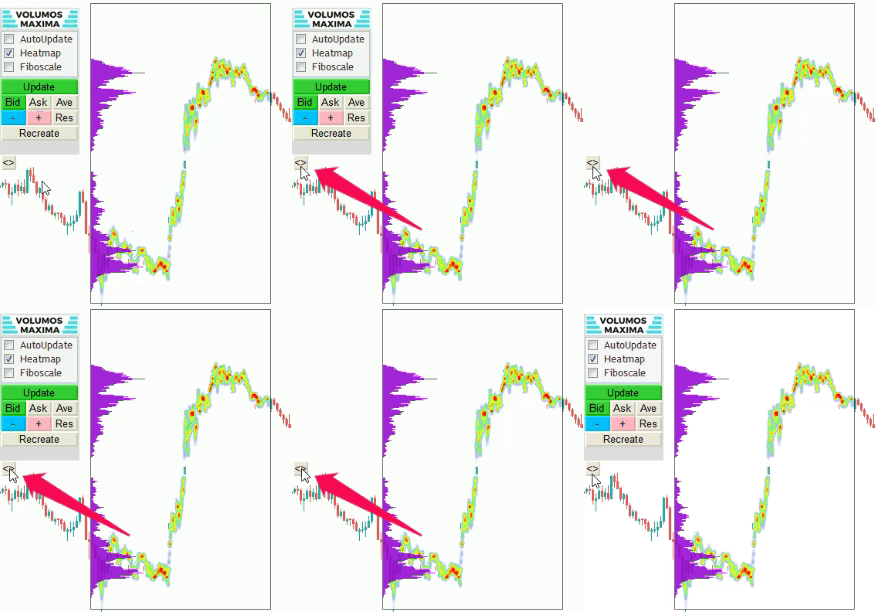
Hide / show panel
Technical limitations
– The work of the indicator is related to the processing of a large amount of data. Namely, information about the volumes. Therefore, the indicator needs time to complete the calculations. It usually takes 1-2 seconds. On timeframes above 4 hours, the amount of data for calculation increases dramatically, so we recommend disabling the “auto-update” checkbox and updating the indicator manually. Otherwise, the indicator will recalculate the value at any change in its position, as well as a change in the chart scale. And as a result, the chart may freeze.
Also, the indicator’s range window will update the data only when it is completely on the visible part of the chart.
– At the moment, we have implemented only the processing of tick volumes. And in the next updates we will add the ability to work with real volumes.
– In this version of the indicator, it is possible to work with only one “range window”. We are considering adding more of these “windows” in future updates.
– This indicator works only for the Metatrader 5 platform. The version for Metatrader 4 will be released later.

0 Comments