In this article, we would like to review the basic approach to volume profiling. If you understand how to use it, then it will become an indispensable tool for analysis.В
Learn the basics of support and resistance
Before diving into trading with volume profile, it’s important to understand the basics of support and resistance. Support is a price level at which buyers are expected to enter the market and prevent prices from falling further. Resistance, on the other hand, is a price level at which sellers are expected to enter the market and prevent prices from rising further.

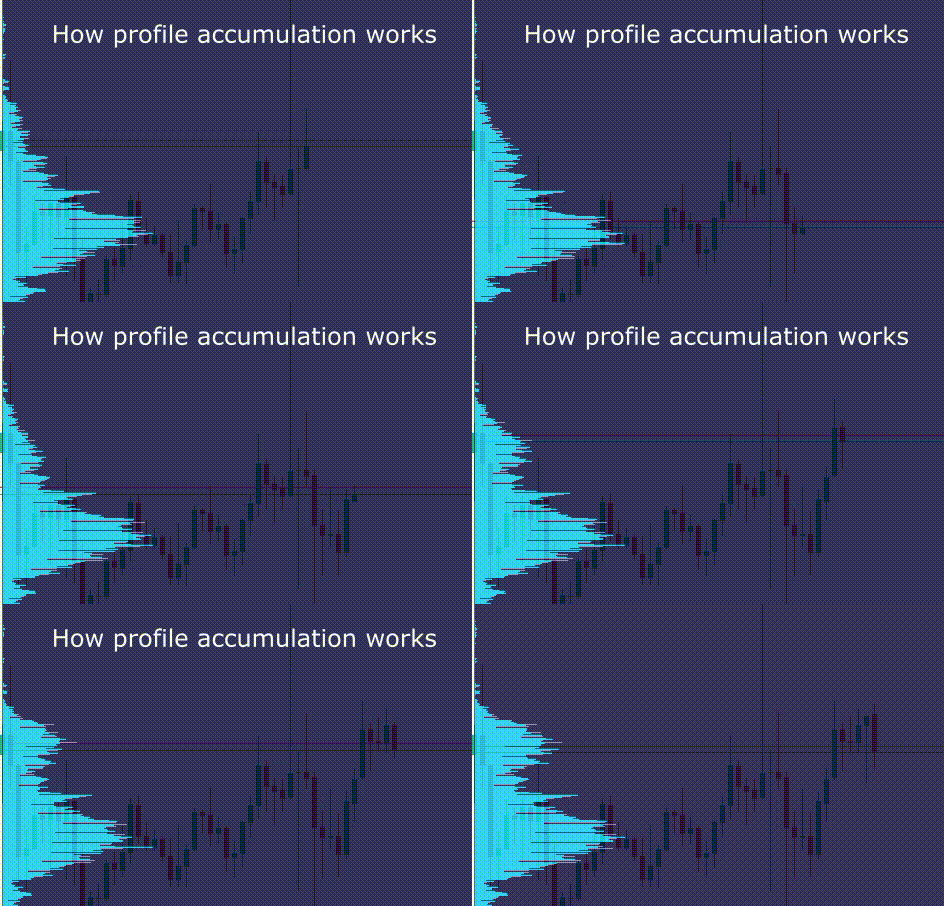
How profile accumulation works
In short, there are two players in the market – bulls and bears. The former want the price to rise. Accordingly, if the price is at an acceptable level for them, then they will intensively buy, hoping to sell and earn in the future. The bears are doing the opposite – they are trying to play on the price decrease.
Accordingly, if we put the indicator on the range we are interested in, then we will see the places with the largest number of transactions. On the histogram, it will look like a “hillock“.
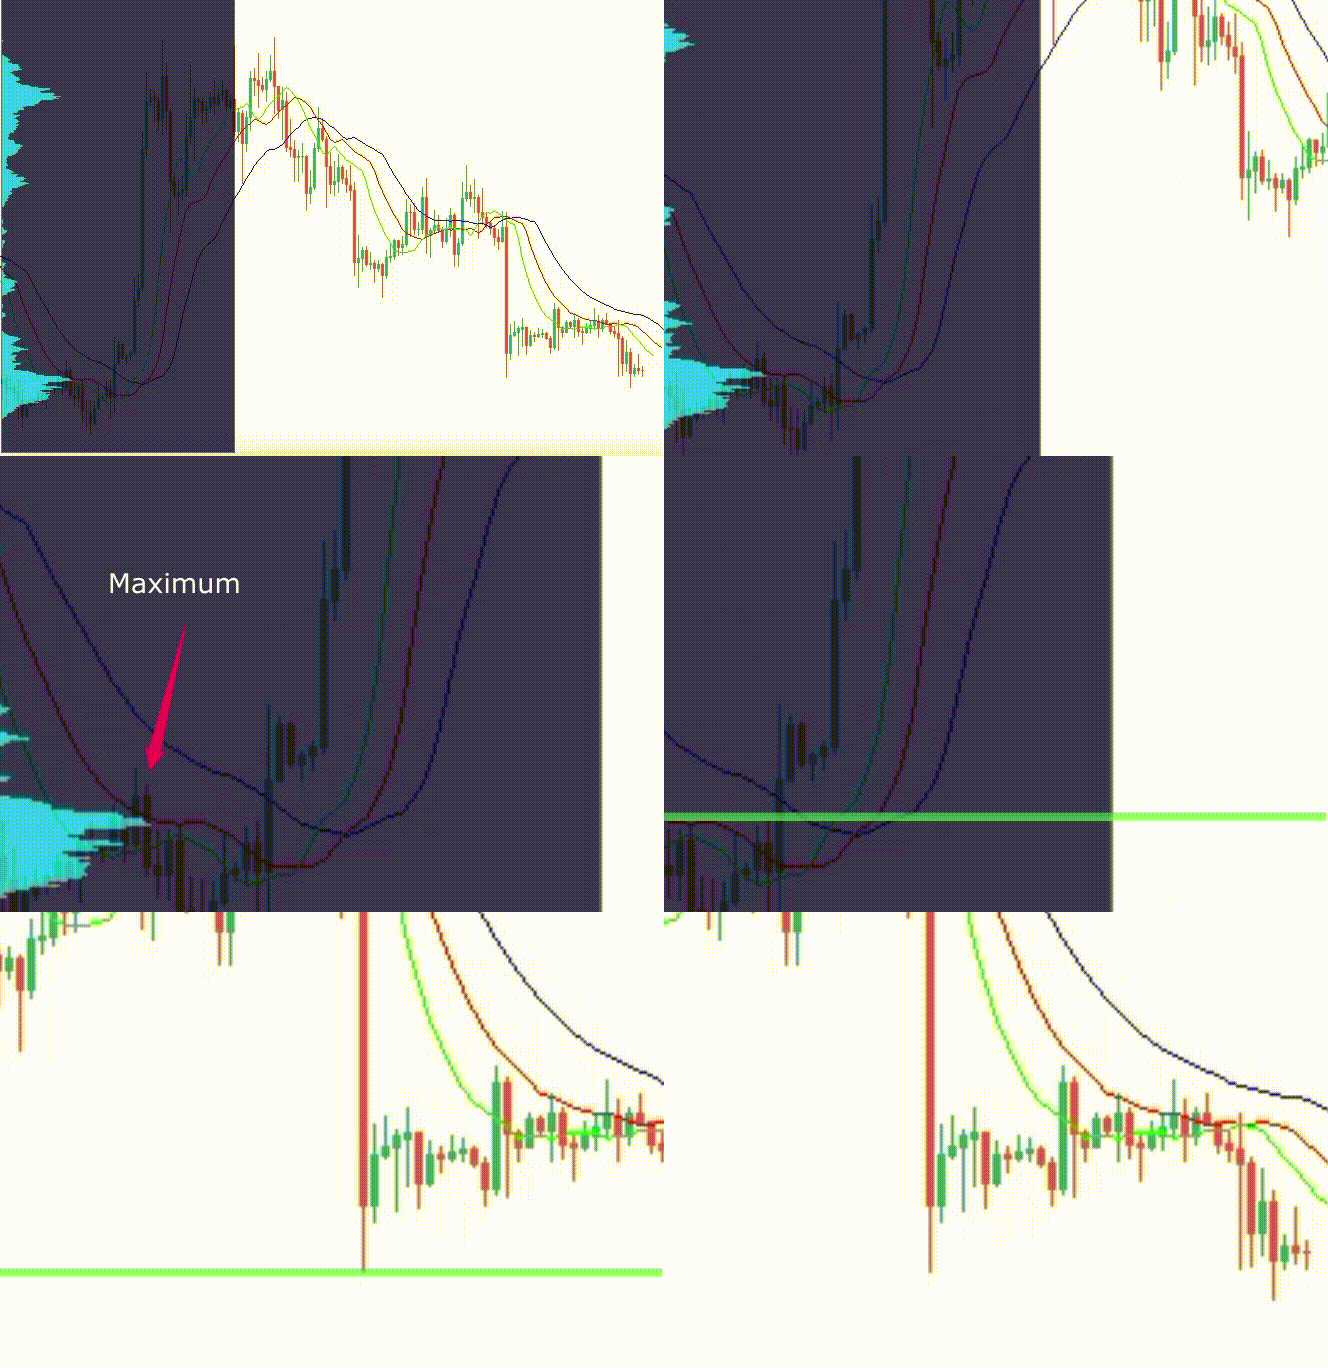
The peak of this accumulation is interpreted as the most traded volume for a specific price in the analyzed range. Given the logic of the behavior of market players – bulls and bears – we can assume that if the price returns to this peak in the near future, it will rebound from it. Why? Because bulls or bears will again intensively defend this price by buying back demand or supply. These considerations underlie the decision to enter the market. That is, all that remains for us is to wait for the price to touch the peak and open a deal.

Price reaction to the maximum in the profile (Bitcoin)
So, we can say that the maximum on the profile can serve as a support or resistance level.
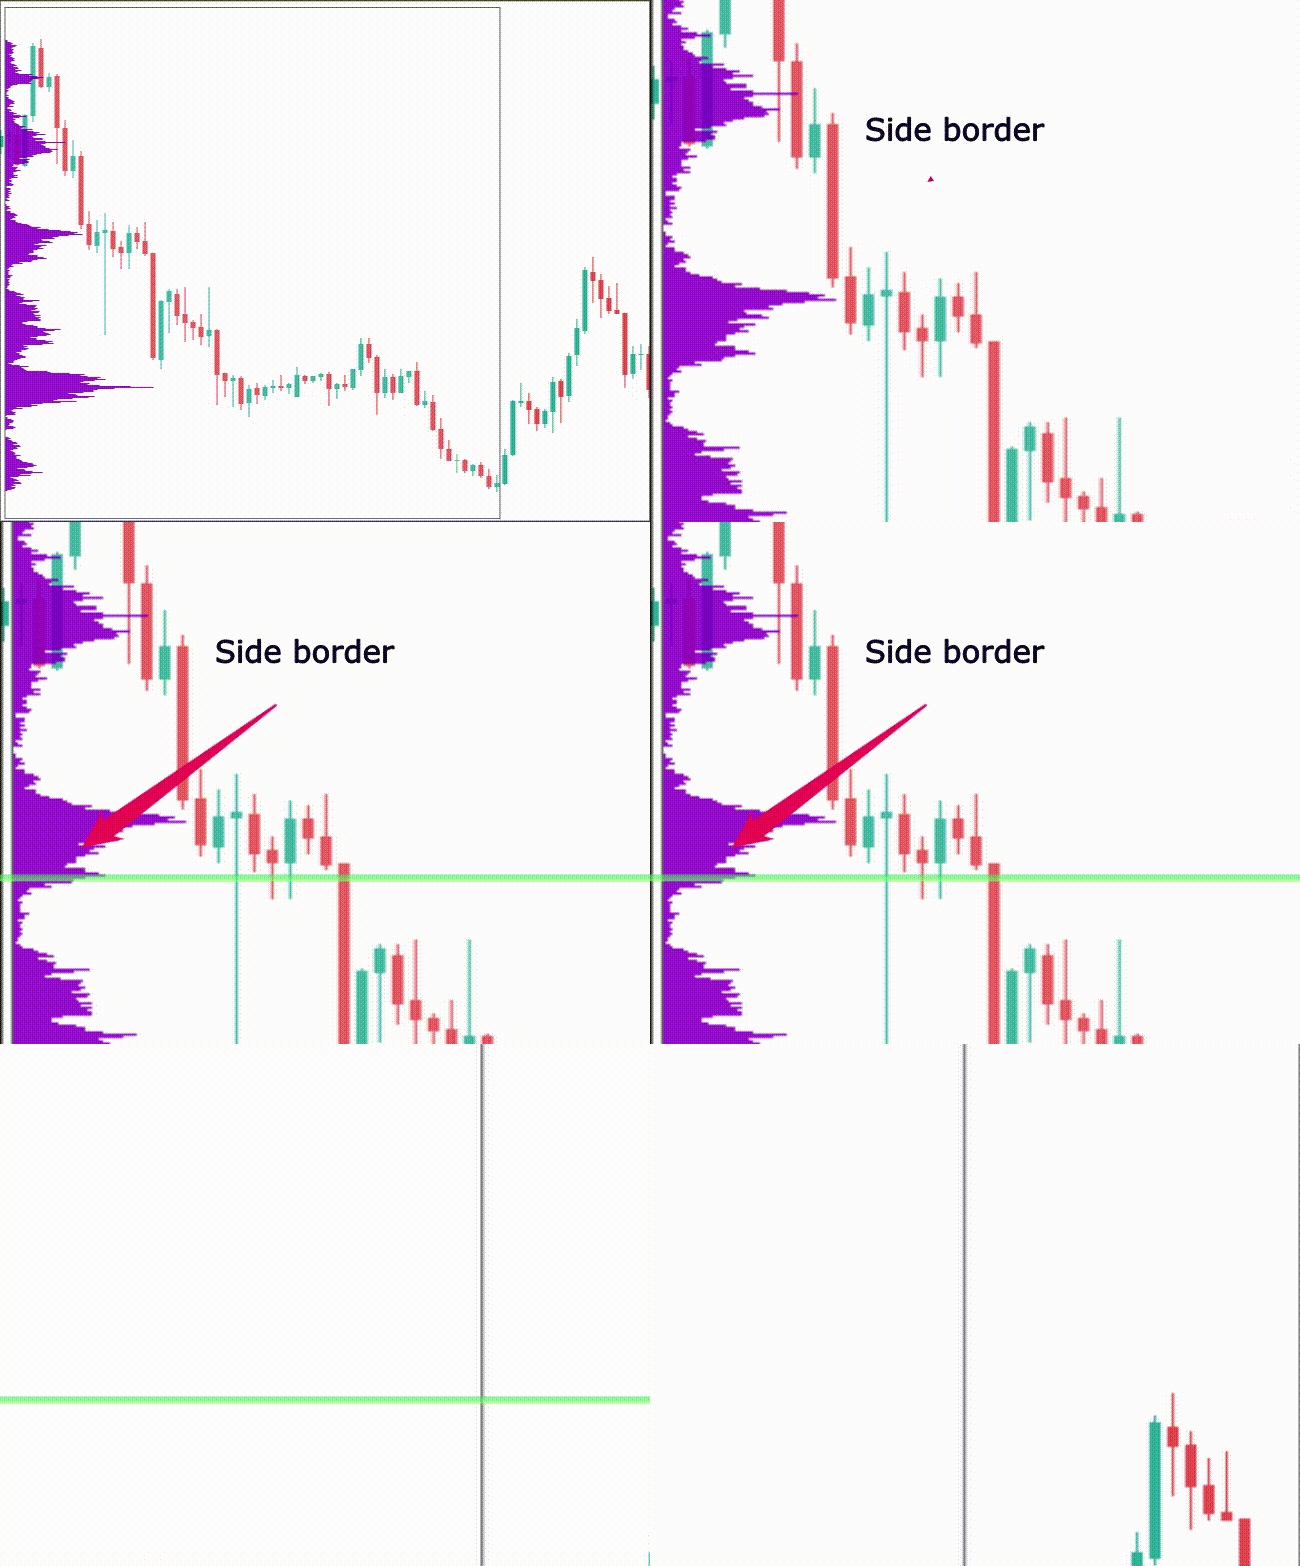
But there is also a good observation to be made. It consists in the following – not only the peak of the histogram can be a price reaction point, but also the side (or border) of volume accumulation.

Reaction to the side border
As you can see, working with the profile and looking for support / resistance levels is very easy.
I would also like to note a very important thing – in trading, the events we expect are of a probabilistic nature. And the market profile is no exception. Therefore, there may be situations when the price will ignore the levels you have found, or react very weakly. Market behavior is complex and cannot be predicted with certainty. While historical trading patterns can provide insights into potential market movements, there are many factors that can influence market behavior, such as economic news, geopolitical events, and unexpected shifts in investor sentiment.
Therefore, consider these features in your risk management and work wisely with your statistics.

0 Comments