Explanation of Fibonacci retracement and extension levels in trading
Fibonacci retracement and extension levels are widely used in technical analysis to identify potential support and resistance levels in a market. The basic idea is that after a significant price movement, the market will often retrace a portion of that movement before continuing in the original direction.
These retracement levels are based on key Fibonacci ratios of 23.6%, 38.2%, 50%, 61.8%, and 78.6%. Traders use these levels to identify potential entry and exit points for trades, as well as to set stop-loss orders to limit potential losses. In addition to retracement levels, traders also use Fibonacci extension levels to identify potential price targets for a market when it is trending strongly.
These extension levels are typically based on ratios of 1.236, 1.618, and 2.618 times the length of the previous price movement. By understanding and using Fibonacci retracement and extension levels, traders can improve their trading performance and make more informed trading decisions.
How it is implemented in our indicator?
When we did the first tests with the volume distribution histogram, we used the standard Fibonacci grid tool in Metatrader to compare maximum savings with fibo levels. It was very inconvenient. And then we decided to implement Fibonacci levels in our indicator.
In Volumos Maxima, the dynamic fibonacci grid is automatically calculated relative to the high and low prices in the selected range. The so-called trend direction is also taken into account. That is, the grid will be drawn in different directions relative to the rise or fall of the price. No need to manually line up the grid each time, as in a standard tool.
The levels themselves are drawn in such a way that it is easy to measure the corrective price movement within the range between the minimum and maximum, as well as further price movement in the future if it leaves the selected range.
Also, the fibonacci grid has arrows with which you can move the level lines. This is very convenient, because it allows you to conduct a qualitative analysis and determine the goals of the price wave movement.
In order to enable the grid, there is a checkbox on the panel that activates the calculation of fibonacci lines.
How to use, real example
For example, you saw a wave on the chart – a clearly formed trend. Then, in order to evaluate the potential price movement in accordance with the Fibanacci levels, you need to set the indicator window so as to capture the beginning and end of the price range. The indicator will automatically calculate the lines so that the 0-level and 100-level coincide with the high and low of the price.
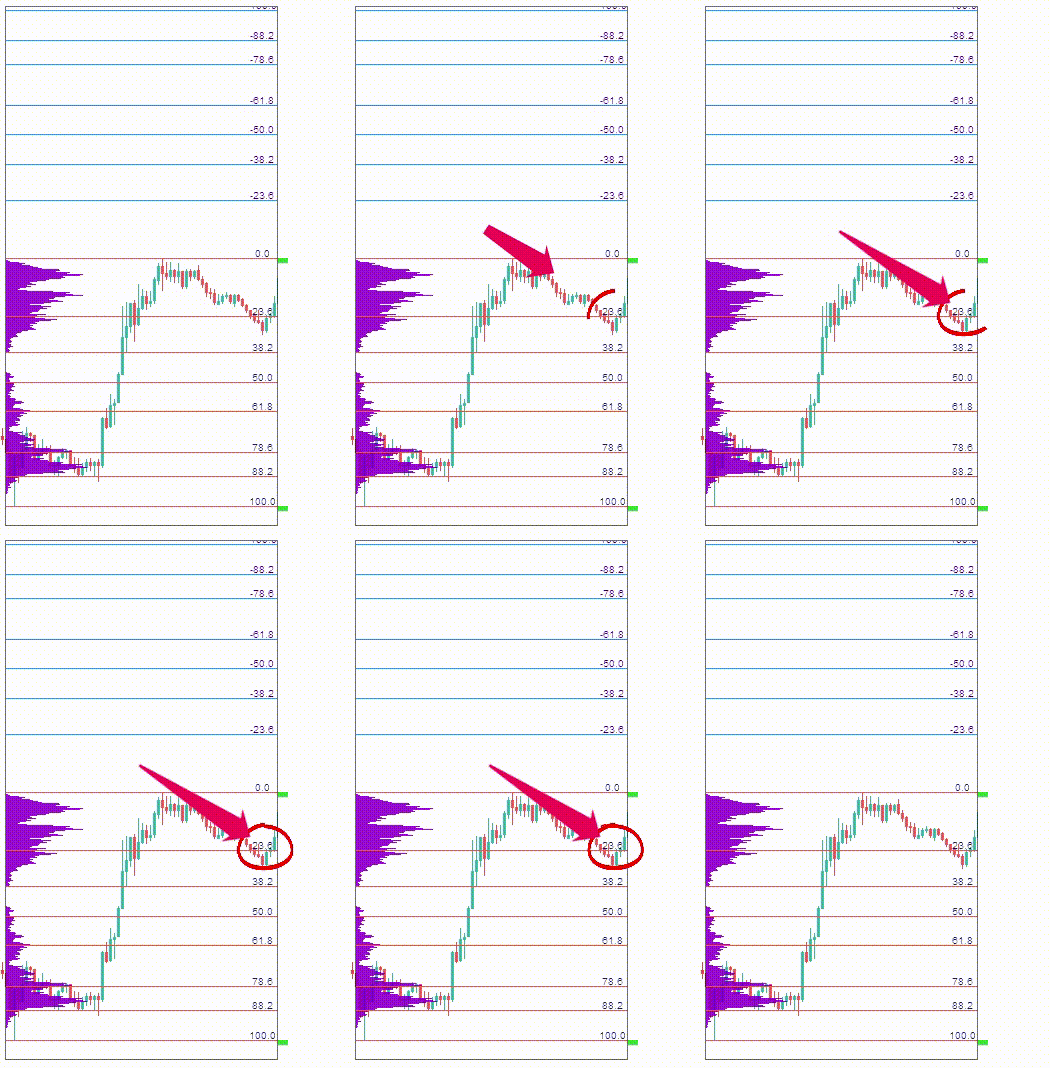
The figure shows that there has already been a rollback to the level of 23.6 and the price continued to move in the direction of the trend. Knowing about the properties of the harmonious price movement, we can use the grid to determine future levels where the price can roll back. That is, if the price continues to move, then we should expect a rebound at levels 23.6, 38.2, 50.0. On the grid, these levels are marked with a minus sign. This is just a symbol of the movement opposite to the correction for the selected range at the moment.

Correction to the 23.6 Fibonacci level
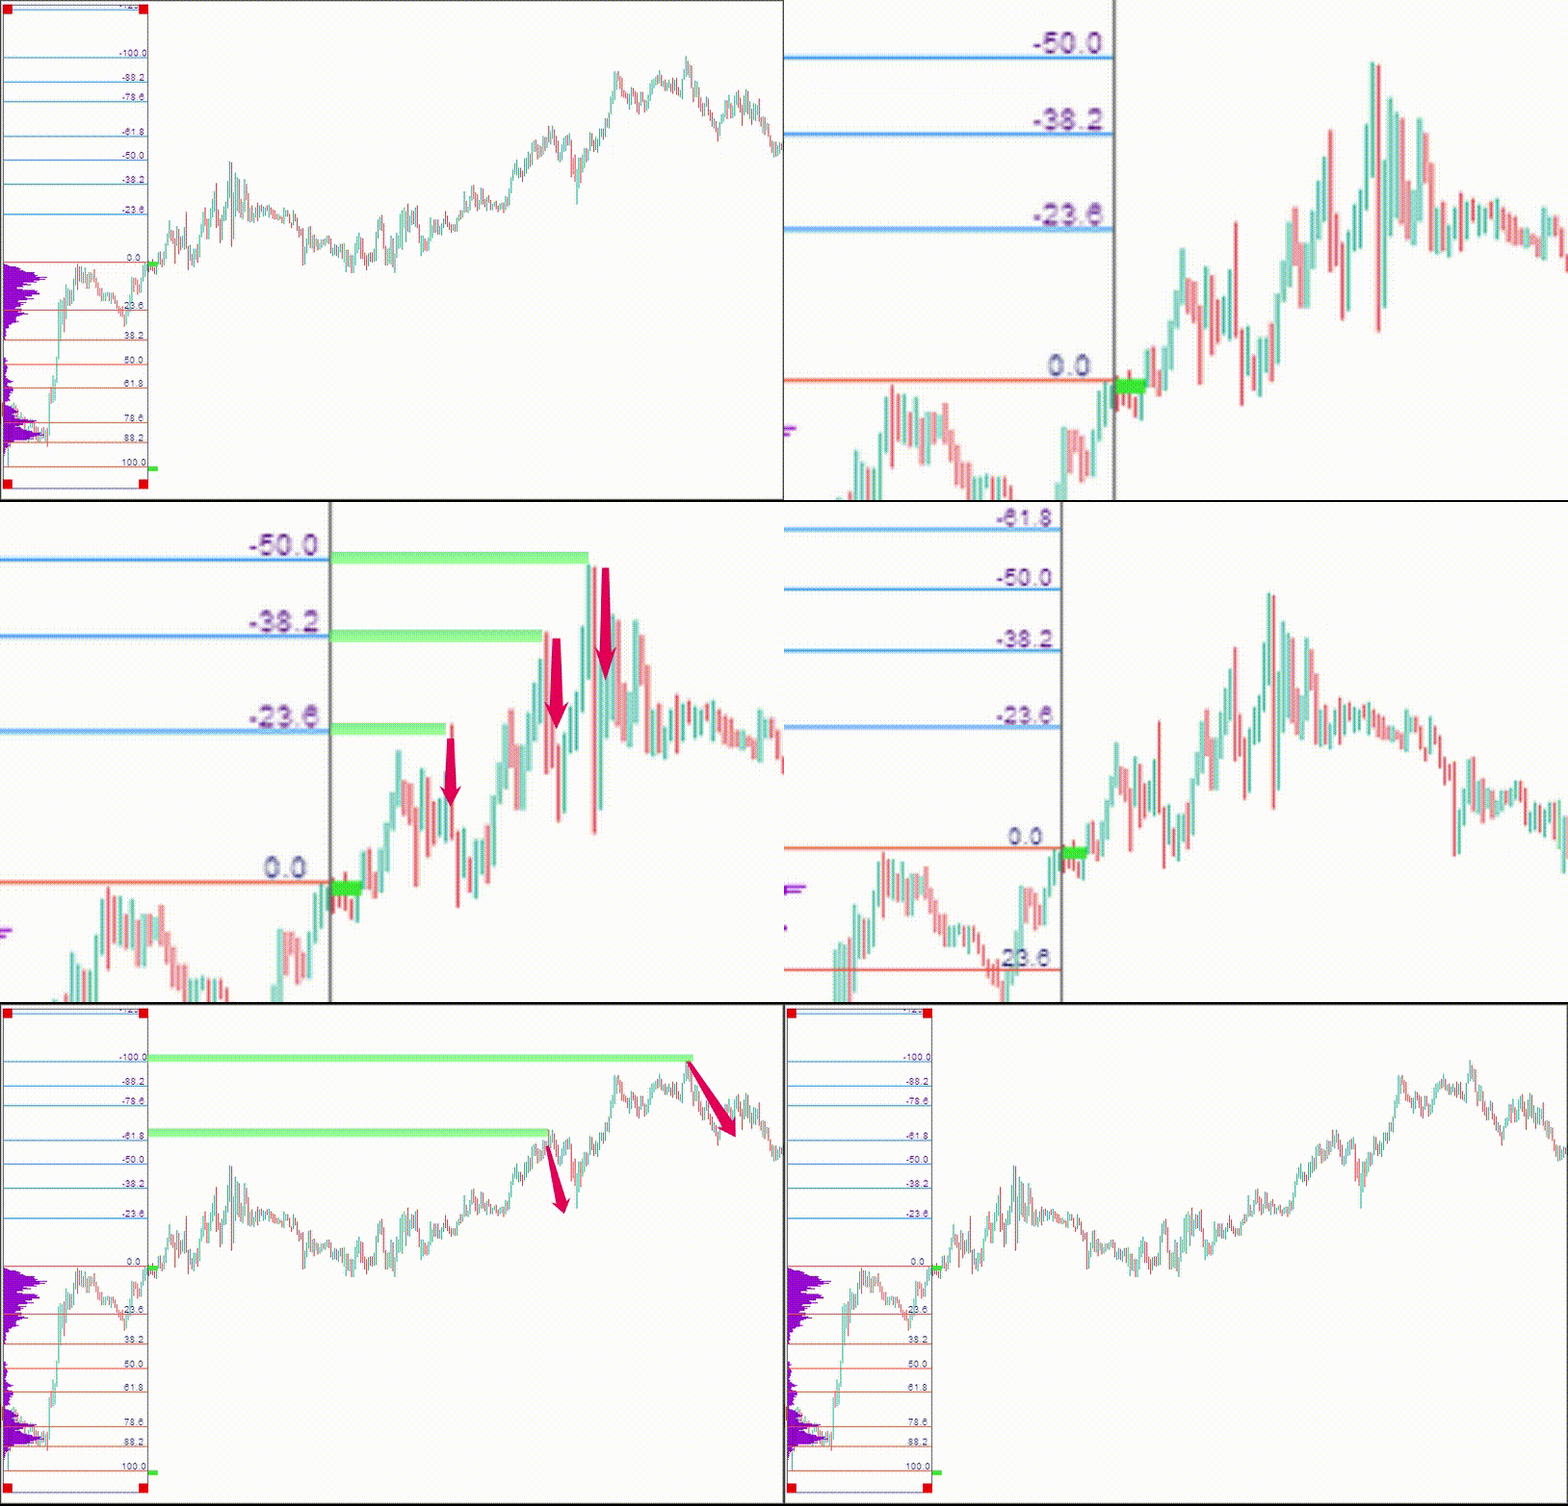
So, after waiting a while, we can observe that the price actually bounced from each of these levels. These are great entry points.

Price reaction to levels 23.6, 38.2, 50.0, 61.8, 100
Conclusion
In conclusion, Fibonacci retracement is a powerful tool that can improve your trading performance by helping you identify potential levels of support and resistance. By using the Fibonacci levels to measure the corrective price movements within a given range, traders can determine potential future levels where the price may experience a rebound or breakout. The Dynamic Fibonacci Grid is an effective way to automate this process and eliminate the need for manual grid alignment. As with any technical analysis tool, it’s important to combine Fibonacci retracement with other indicators and analysis techniques to make informed trading decisions. Overall, mastering Fibonacci retracement can take time and practice, but it’s a valuable addition to any trader’s toolkit

0 Comments