Volume Profile
with Heatmap
Excellent indicator for price analysis,
identifying key support and resistance levels
for MetaTrader
Professional Tool for Confident Trading
With our Volume Profile indicator, traders can quickly and easily analyze volume at different price levels, gaining insights into market dynamics and making trades with greater precision and confidence. This tool has been tested and proven by our team of professional traders, ensuring its reliability and accuracy.
Dynamic Fibonacci Grid
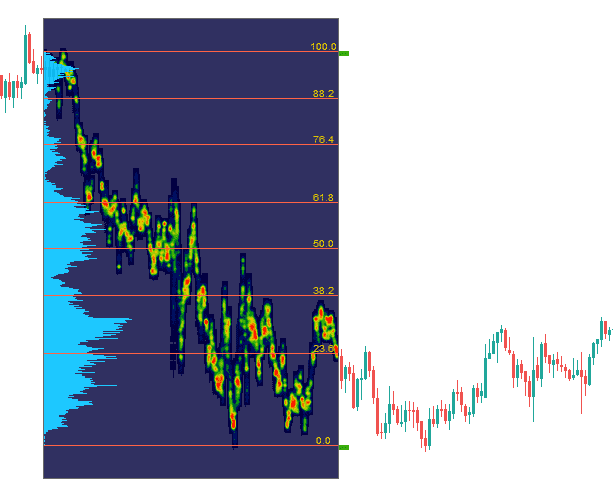
Our Dynamic Fibonacci Grid feature automatically calculates the maximum and minimum prices of an range and then draws Fibonacci retracement levels, giving traders a clear and easy-to-use tool to identify potential support and resistance levels.
Price Heatmap
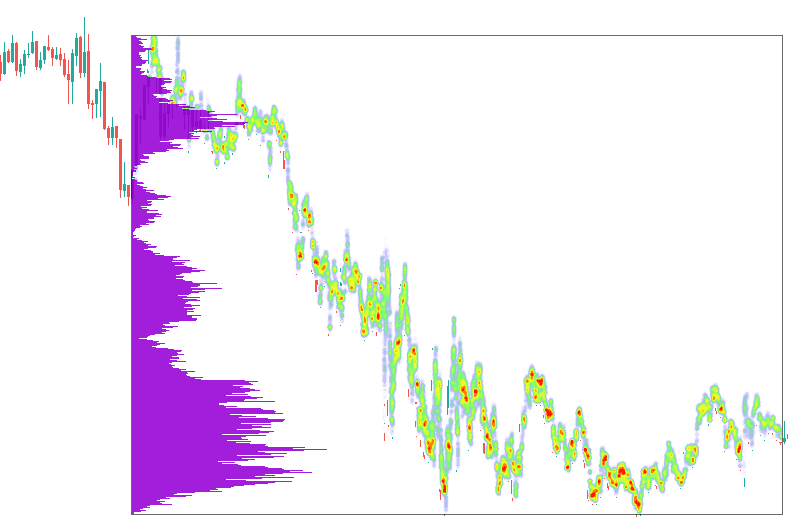
Our Volume Profile indicator includes a Heatmap feature that displays the distribution of trading volume at different price levels, allowing traders to visualize the volume density and quickly identify areas of high or low trading activity. This can help traders pinpoint potential areas of price reversal, making it easier to make informed trading decisions and maximize their profits.
Comprehensive View of Trading Activity
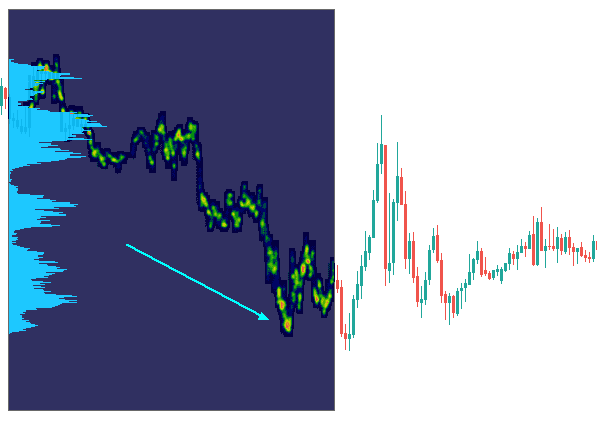
The Volume Profile indicator with Heatmap provides a comprehensive view of trading activity in the market, allowing traders to quickly identify key levels of support and resistance as well as potential areas of price reversal.
Visualize Distribution of Trading Volume
The Heatmap feature allows traders to visualize the distribution of trading volume across different price levels, making it easier to spot areas of high or low trading activity
Understand Market Trends and Patterns
With the Volume Profile indicator, traders can gain valuable insights into market dynamics and make more informed trading decisions.
Stay Ahead of the Market with Confidence
The Volume Profile indicator can help traders identify areas of value in the market, allowing them to make more strategic trading decisions and maximize their profits.
Improve Risk Management and Trading Strategy
The Heatmap feature allows traders to easily identify areas of high trading activity, which can be useful for setting stop-loss orders or taking profit.
Dynamic Fibonacci Grid
By using the Dynamic Fibonacci Grid, traders can take advantage of these key levels to set stop-loss orders, take-profit orders, or enter and exit trades with greater confidence, improving their risk management and potentially increasing their profits.
“As a scalper, timing is everything for me. The Volume Profile indicator with Heatmap has been incredibly useful in helping me to identify areas of high trading activity and potential price reversal, which are key for my trading strategy. I’ve been able to improve my entries and exits, and have seen a significant improvement in my profitability since incorporating this indicator into my trading“

Jonas Kano
First customer and tester


